Cashflow
Manager
Procore forecasts your costs or your revenue. Never both. Cashflow Manager forecasts the whole cash flow, month by month, from the data already in your project.
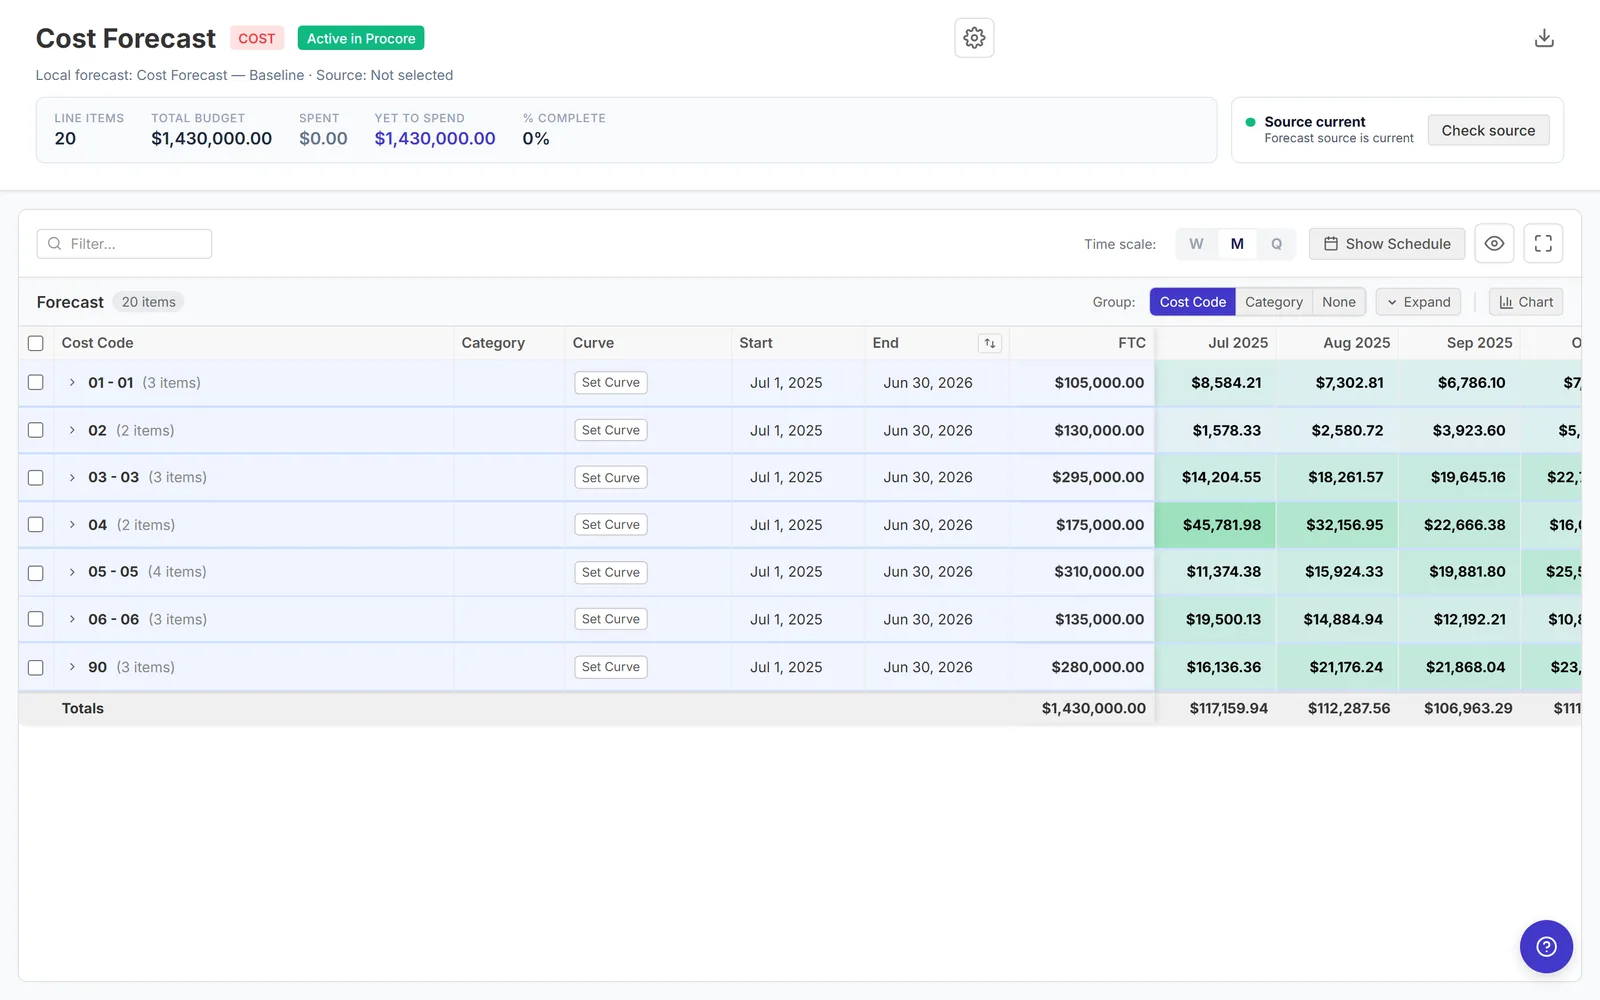
Set a curve, not a thousand cells.
Pick an S-curve, bell or front-loaded spread for each cost code and the months fill themselves in. When it's right, push it straight back into Procore's Advanced Forecasting.
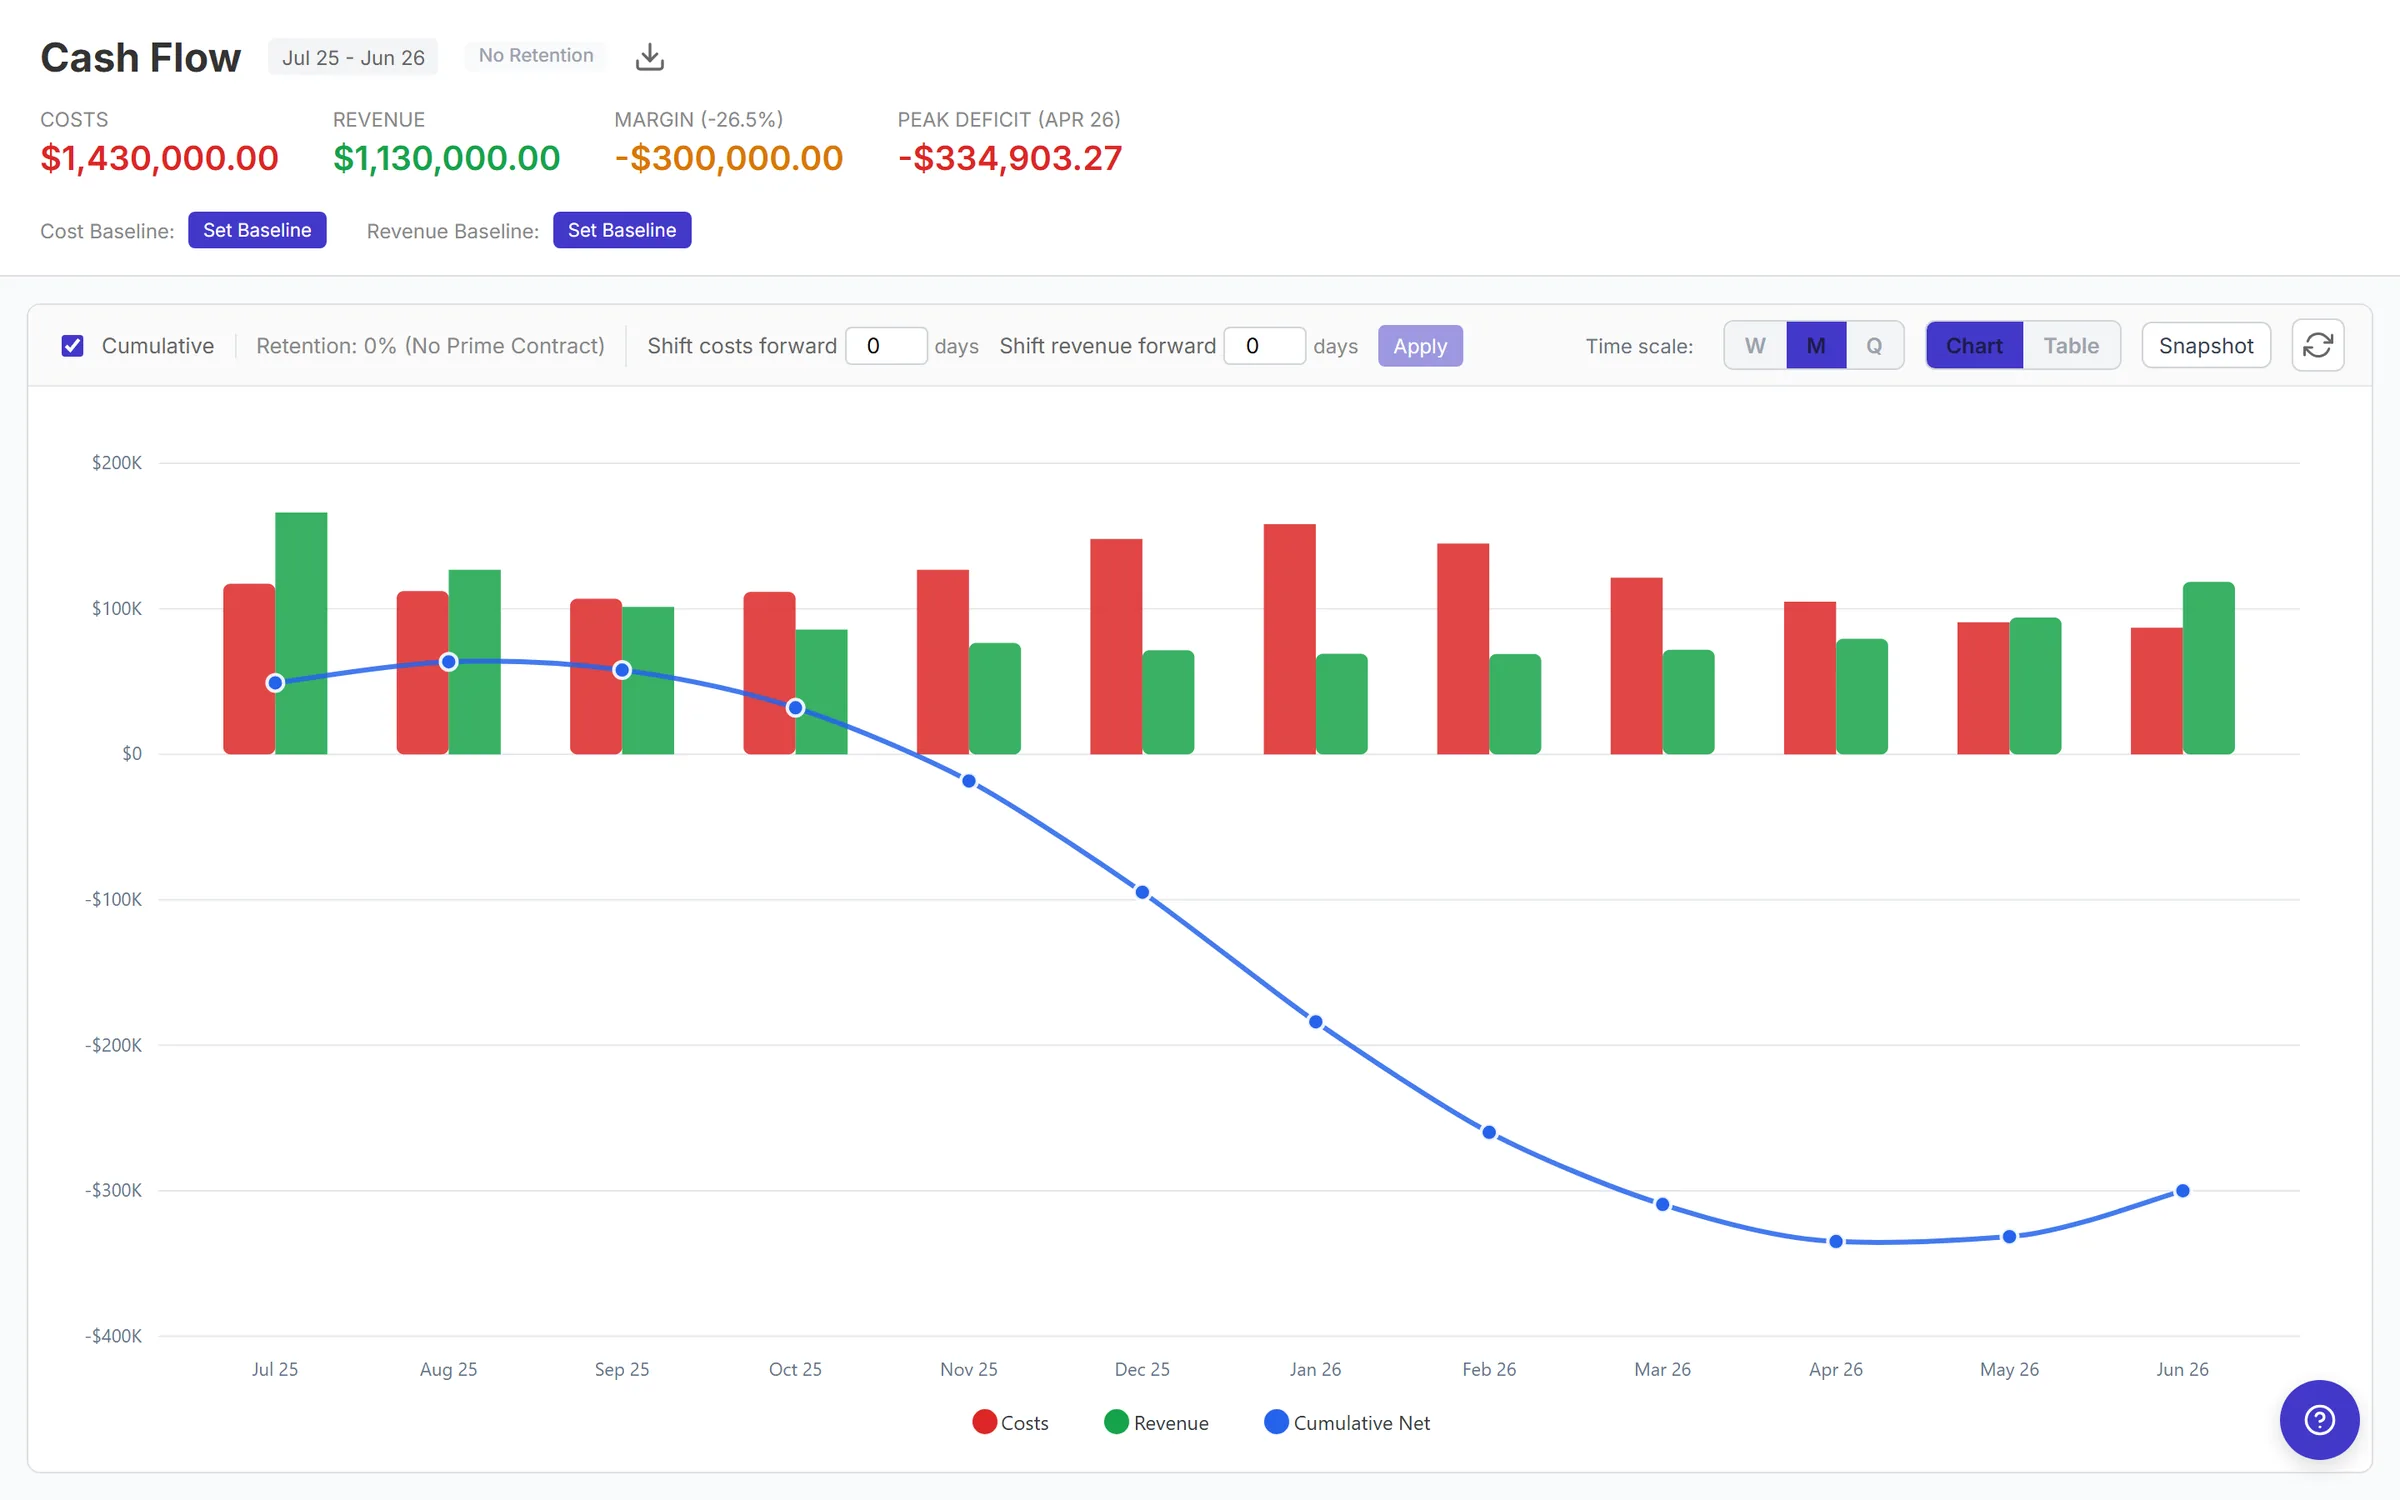
See the hole before you're in it.
Costs against revenue, with retentions and payment timing built in. Run a few scenarios, lock a baseline, and as actuals come in the forecast keeps itself honest.
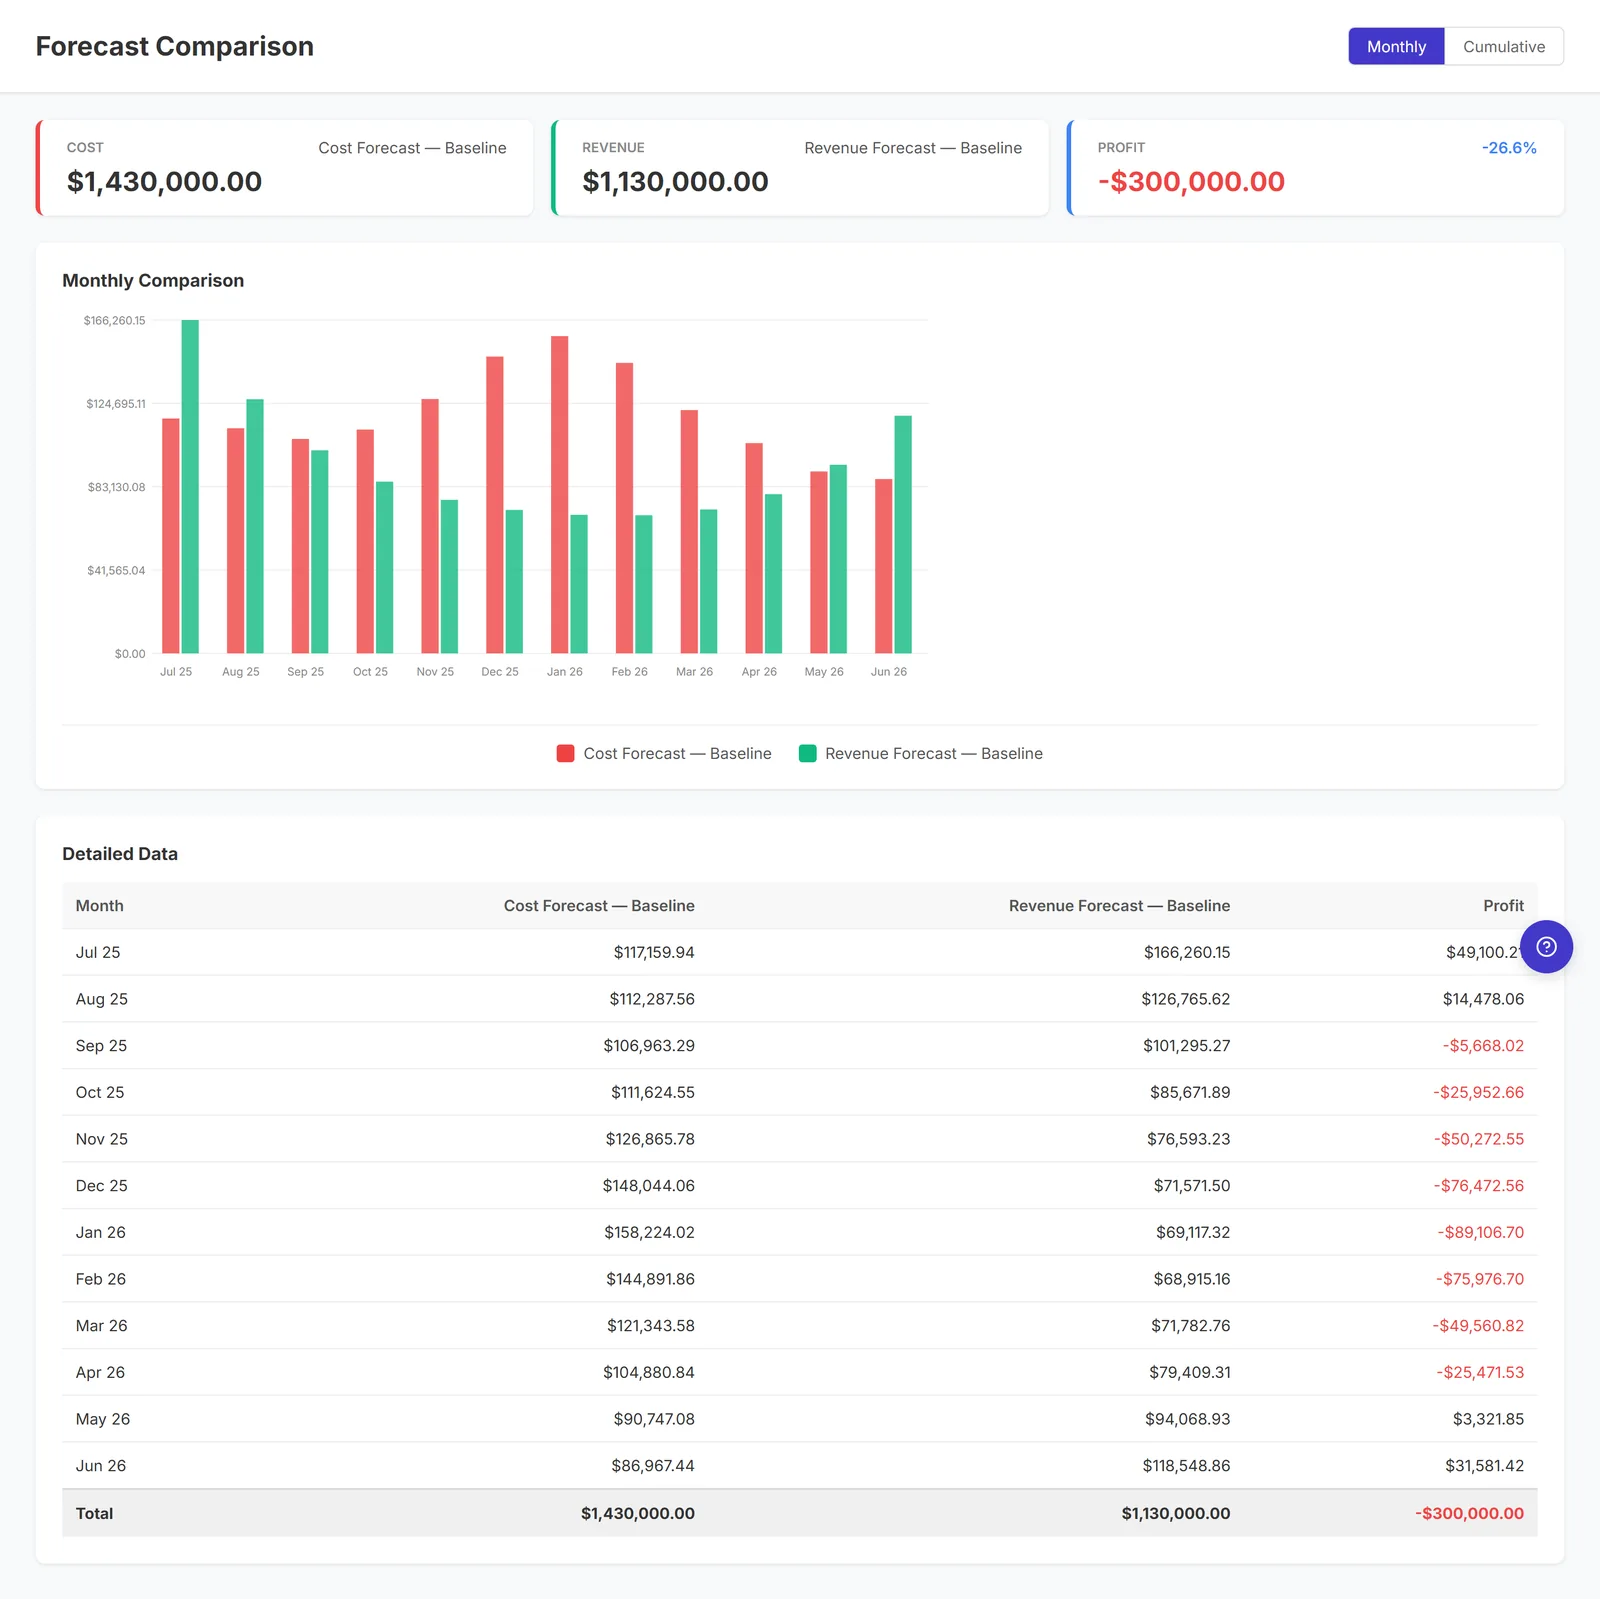
The problem
Procore tracks your budget and contracts, but it only lets you forecast one side of the equation. You can use the Forecast Tool for revenue, or make revenue part of your budget, but there's no way to get a complete cash flow picture. You're stuck forecasting costs or revenue, not both together.
What it does
- Forecast both cost and revenue in one place
- See your full cash flow picture
- Forecast at the group level
- Handle retentions
- Create multiple scenarios (A, B, C) for comparison
- Set a baseline and track variance month over month
- Export reports
Who it's for
Project managers and finance teams who need the full picture, not just one side of the ledger.
← All products